
Design has evolved from a mere tool for visuals and products to a process, strategic methodology, and philosophy. Its pivotal role in shaping user experience, systemic change, political and governmental processes as well as other fields is now being recognized by many. In particular, strategic design has been used effectively in impact evaluation for social enterprises.
There are many reasons why a social enterprise needs to understand and evaluate its impact, including:
- It works as a feedback mechanism to improve the enterprise’s services and products
- For B-Corp certification
- To report back to users and stakeholders
- To attract new investors or retain them
- To keep an alignment with its social mission
To meet impact evaluation needs, there are 3 strategic design methods and tools that managers, CEOs and/or directors of social enterprises can use. The methods described below do not require any design expertise and can be used in the same way a company would use a SWOT analysis, or a business model canvas. The step-by-step processes for each method are mostly available online.
The tools can help:
- Collect and analyze new types of impact data
- Present an organic evolution of impact
- Understand stakeholder and target audience
1.Stakeholder Analysis Matrix
Social Enterprises are mostly focused on providing the best value to their stakeholders and intending to do social good while aiming not to harm the environment. Since stakeholders are a crucial element of all their work, it is important to understand them. Stakeholder analysis means analyzing and researching on the following questions:
- Who are the stakeholders?
- How are they being impacted by the SE?
- How are they impacting company decisions?
- What are their pains and gains?
- How can the SE add more value by relieving their pains?
There are different tools used by strategic designers to expand on each of the above points. Two of the most useful tools to conduct a stakeholder analysis are stakeholder matrix and a value proposition canvas.
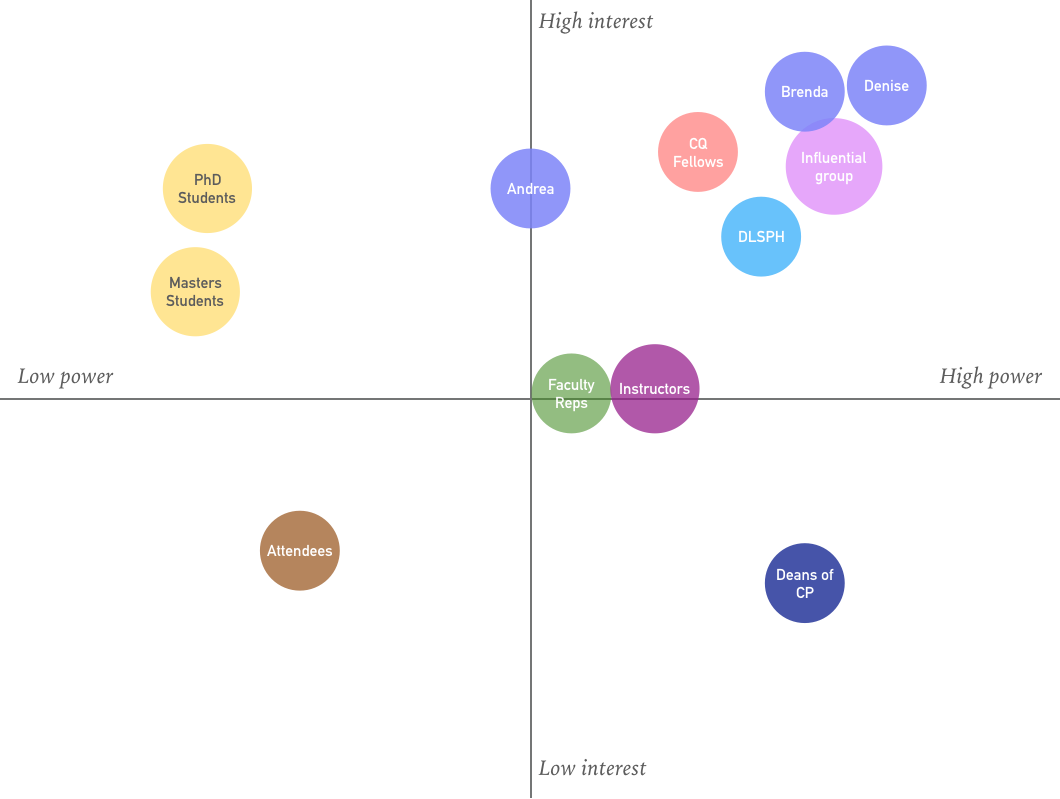
Stakeholder matrix is a 2×2 matrix (as shown in the image above) with interest and power as the two variables. It helps configure the stakeholders’ interest in work being done by the social enterprise and stakeholders’ power to influence SE’s decisions and future activities. Based on the positioning of various stakeholder groups, strategies can be designed to push particular stakeholder groups from one quadrant to another, increasing or decreasing their power or interest.
Basic How-to:
Make a 2×2 matrix as shown in the image. On the x-axis mark high power and low power, then on the y-axis, mark high interest and low interest. With your team, start by brainstorming a list of all the different stakeholders. From the list, discuss each stakeholder and analyze where they can be placed on the matrix relative to one another. This activity can be done offline with stickies and board/paper or can be done using online tools such as stormboard.com.
2. Journey Maps

Journey maps are used to visually unwrap a day, week, month, year or a lifetime of a particular persona from a stakeholder group. It is often used by user experience designers and researchers to make sense of the existing patterns of users and define how their services/products will enhance their experience.
The same concept can be used for the stakeholders of a social enterprise. Journey maps can be used for impact evaluation in two steps:
- Before the product/service is launched: understand the stakeholder journeys by studying particular personas from different stakeholder groups.
- Couple of years after the products/service has been launched: study the changes in the journeys after the stakeholders have had an impact of the product or service.
Based on the two maps, compare the journeys to point out the differences and similarities. Ask whether the initial goals and objectives of the product/service were met or not. Did the product/service add any value to the stakeholder’s journey? The map can also be used to deduce relevant impact evaluation indicators (KPIs). This feedback can be instrumental in designing future strategies and having a relevant conversation with the investors or stakeholders about impact.
Basic How-to:
Select some representatives from particular stakeholder groups to conduct research. Use ethnographic research, feedback reports, and design probes to map the journey patterns of those representatives. If there are assumed events or scenarios, they must be mentioned. Using stickies, or markers and board, or online tools to make the journey map. There are different methods to sift the information for the map in terms of themes or sections or axes. Use any one relevant to the journey, discuss details and mark particular areas with the team.
3. Visual Logic Model Mapping
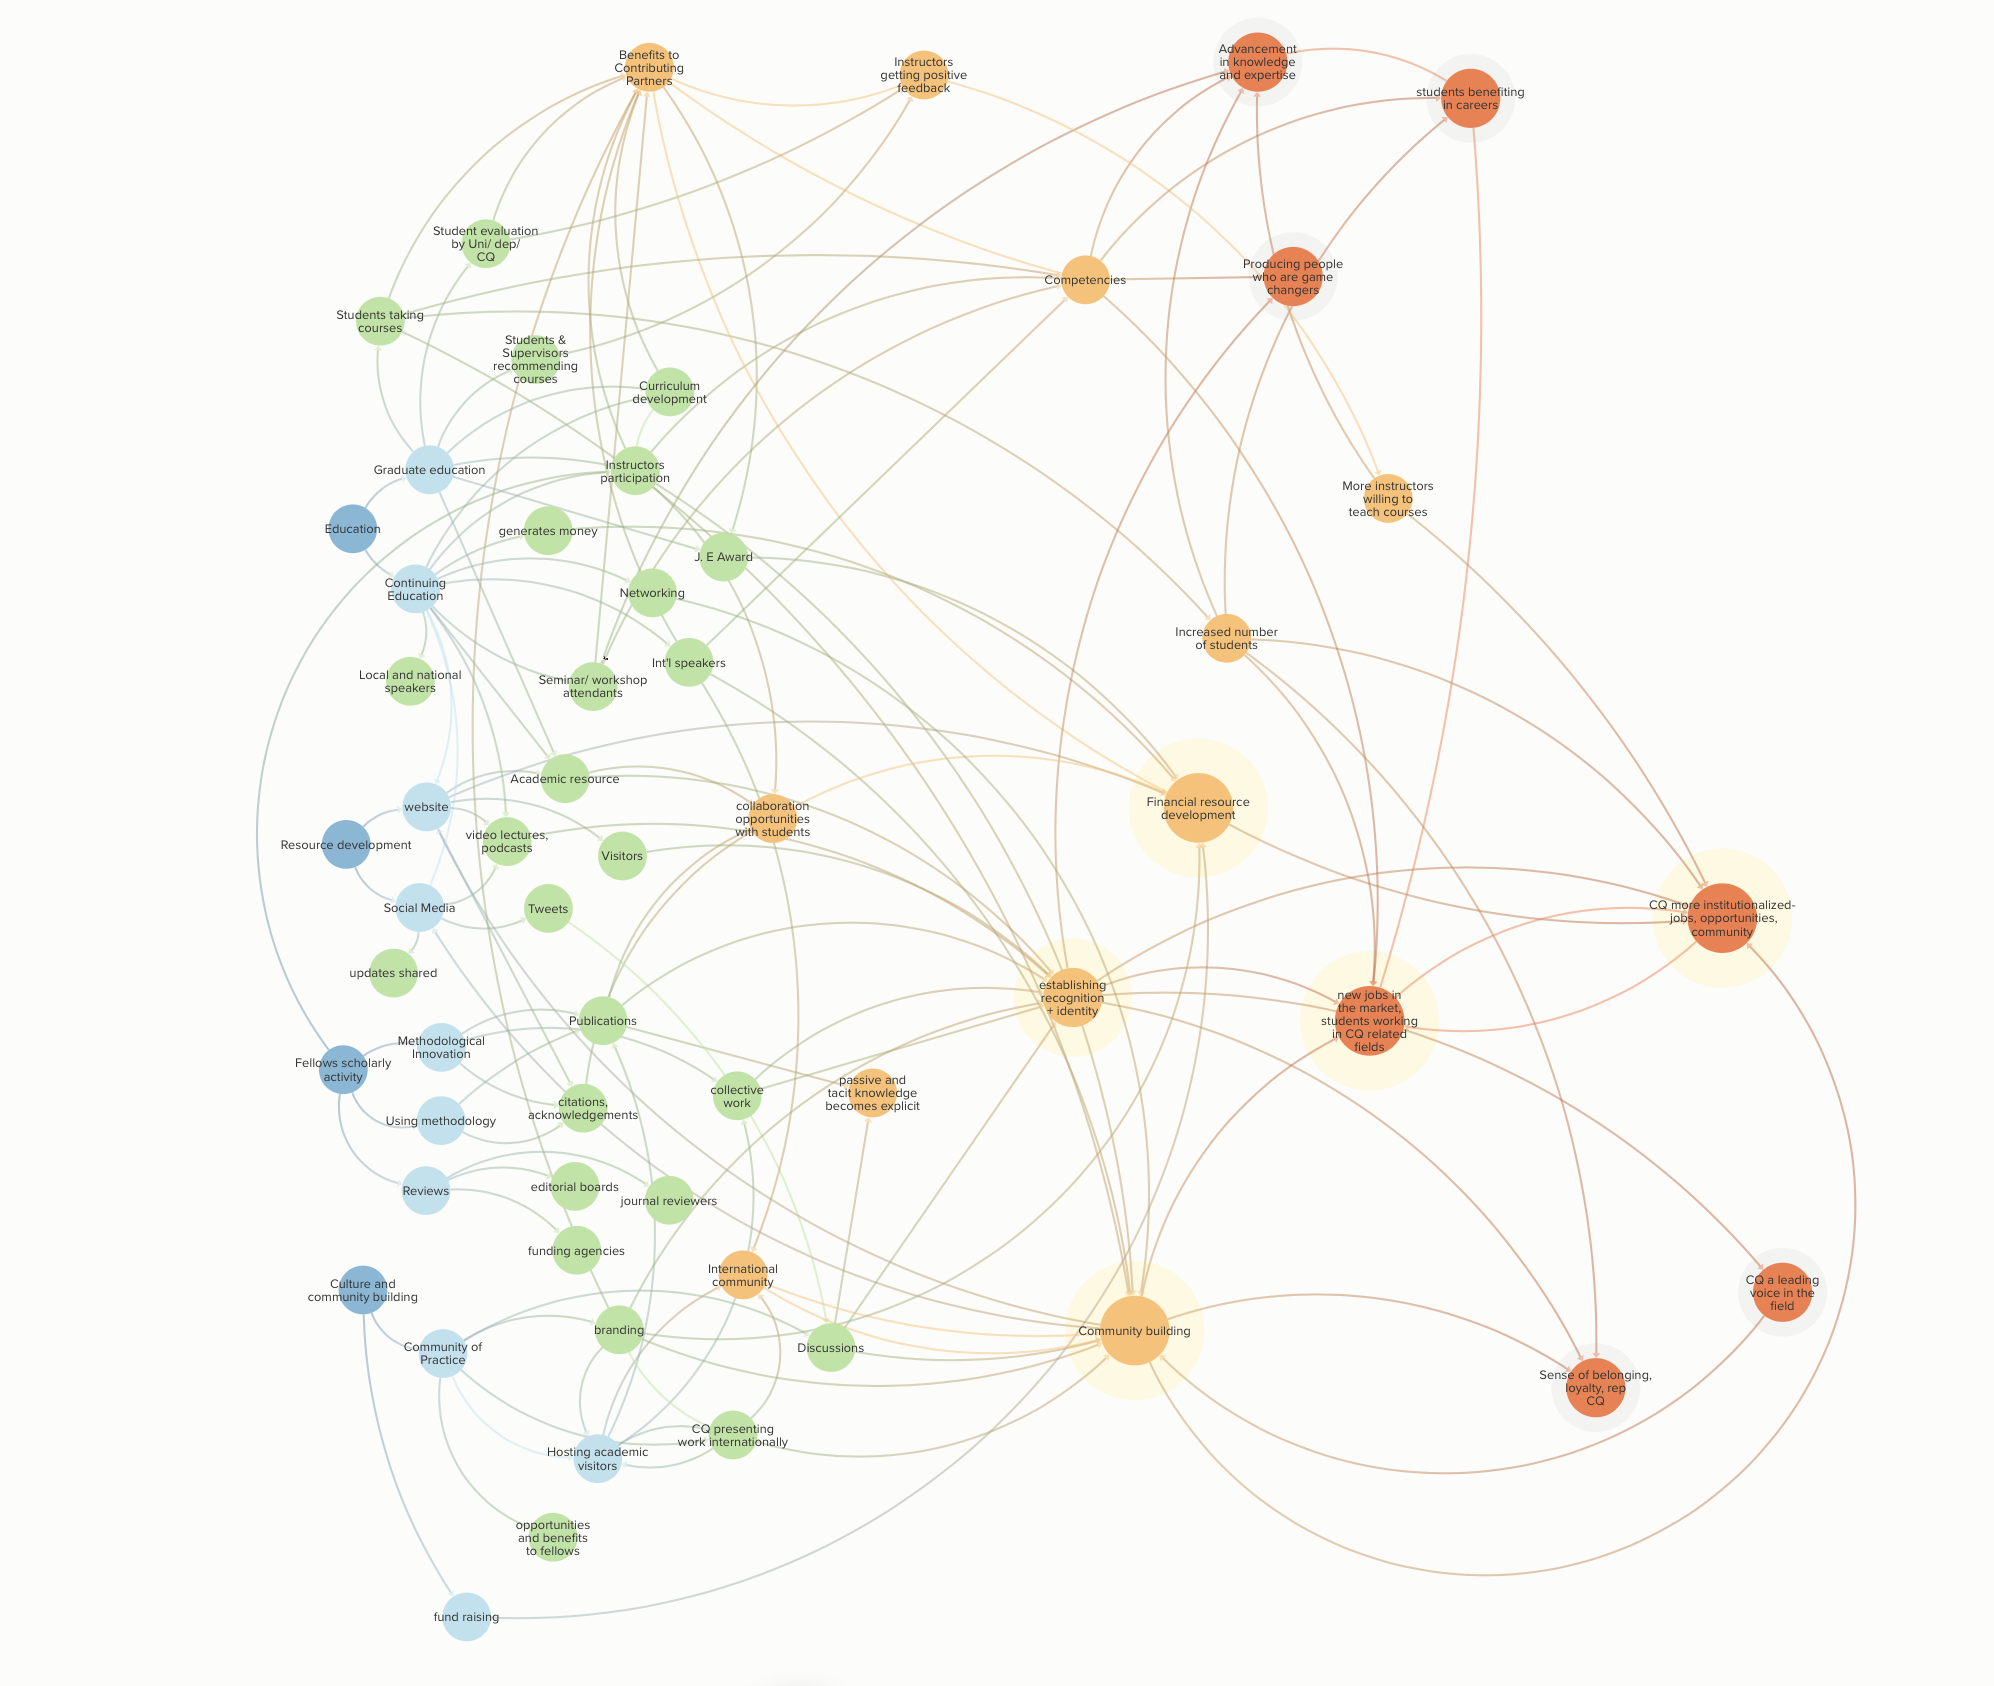
Logic models are mostly used by programs and organizations to find links between inputs, activities, outputs, outcomes, and impact. The conventional approach to making logic models is to make a table with columns for each segment and list down inputs, activities, outputs, outcomes, and impacts. The problem with this approach is that it suggests a linear evolution of impact, which is not true in reality.
For most social enterprises the inputs and activities turning to impact is a very organic and complex process. The linearity represented by a table sets linear, uniform expectations for stakeholders and investors. Also, it makes it difficult for social enterprises to continue extracting the linear image of impact from their complex and multi-dimensional outcomes. Visually mapping the logic model (as shown in the image above) can help bridge this gap.
According to Oxford dictionaries, Mapping is ‘an operation that associates each element of a given set (the domain) with one or more elements of a second set (the range).’ Imagine mind maps when thinking of mapping a logic model. Mapping the logic model shows a holistic picture and helps visualize the complexity. Visual mapping is a method widely used by designers and systems thinkers to unravel the linkages and connections, as well as to understand the deeper association with a given subject matter.
Basic How-to:
Work with the team using stickies and markers or using an online software such as kumu.io. Start by having a conversation about the company’s activities and resources. Then build connections from activities and inputs to immediate outputs, mid-term outcomes, and long-term impacts. Review the logic model after every 3-5 years (or less) to evaluate the initial assumptions and to analyze how the outcomes and impact changed or stayed the same based on the impact data and feedback.
All these methods don’t have to be used one after another, instead they can be picked on the basis of need. These three methods are flexible enough to be customized and personalized. The tools are there to provide structure and help lead and visualize conversations about impact. Remember, evaluating impact is not always about numbers, it’s about “how” an initiative leads towards a better future.

Excellent.
Thank you!